Monitoring
Ways to sample ambient air
There are 5 main methods of sampling air quality. Each method has advantages and disadvantages depending what is required of the monitoring survey.
- Passive Monitoring
- Diffusion tubes absorb a specific pollutant from the ambient air - no power supply is needed
- Diffusion tubes normally monitor for 2-4 weeks at a time
- There is an array of pollutants that can be measured by different tubes. The most common are NO2 and VOCs.
- The tubes must be sent to a laboratory for analysis to see how much pollution they have detected
- There are hundreds of NO2 diffusion tube monitoring locations around Kent and Medway, managed on a local authority basis.
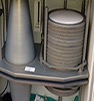
- Active (Semi Automatic) Sampling
- An analyser pulls the ambient air through a filter for a set period of time e.g. one filter per day
- The filters are then collected and sent to a laboratory for analysis to see how much pollution they have detected
- TOMPs, Heavy Metals and Particulates are commonly measure in this way. See our pollutants section for more information on each.
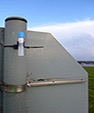
- Automatic point monitoring
- Ambient air is pulled through an analyser which recognises the chosen gas and will calculate its concentration
- Automatic sites monitor pollutants 24 hours a day
- Data are sent from the site directly to your computer, tablet or smartphone via servers which means it can be seen almost instantly.
- There are 13 automatic monitoring locations in the Kent and Medway Air Quality Network. With more sites across the region affiliated to other networks, including the national AURN.
- Data can be viewed on the home page so that everyone can see what the near-real time air quality is like.
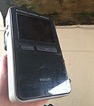
- Photochemical and optical sensor systems
- These are portable monitoring tools that can continuously monitor a range of pollutants. The sensors are of low sensitivity and mostly suitable for identifying hotspots at roadsides and near point sources.
- Data can be downloaded to your computer and analysed.
- These technologies are advancing rapidly and becoming a widely used tool for assessing urban air quality.
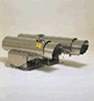
- Remote optical/long-path monitoring
- This method of sampling detects pollution between a light source and a detector which are placed separately at a site.
- Real time measurements can be taken with this type of sampling.
- Data can be sent from the analyser directly to your computer which means it can be seen instantly.
- Find out more about remote optical sensing and studies taking place here.
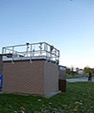
Monitoring Locations
Monitoring stations (or sites) are usually classified according to which environment they are located in. This allows more meaningful evaluation of the data and allows comparison between sites of a similar type. The monitoring site classifications used by District Councils for Local Air Quality Management purposes, are described below. (This is taken from the Local Air Quality Management Technical Guidance document, LAQM.TG(16)). These site descriptions typically reflect the general surroundings (e.g. urban or rural), and/or indicate important sources of pollution (e.g. ‘roadside’ or ‘industrial’).
| Location | Description |
|
Urban Centre |
An urban location representative of typical population exposure in towns or city centres e.g. pedestrian precincts and shopping areas. |
|
Urban Background |
An urban location distanced from sources and therefore broadly representative of city-wide background conditions e.g. urban residential areas. |
|
Suburban |
A location type situated in a residential area on the outskirts of a town or city. |
|
Roadside |
A site sampling between one to five metres of the kerb of a busy road (distance can be up to 10m from the kerb). |
|
Kerbside |
A site sampling within 1 m of the kerb of a busy road. |
|
Industrial |
An area where industrial sources make an important contribution to the total pollution burden. |
|
Rural |
An open countryside location, in an area of low population distanced as far as possible from roads, populated and industrial areas. |
|
Other |
Any special source-orientated or location category covering monitoring undertaken in relation to specific emission sources such as power stations, car parks or tunnels. |
Why and How We Monitor
Air quality monitoring is the principle scientific method for determining the concentration or level of a particular pollutant present in the ambient air at a specific point in time.
Kent and Medway local authorities as well as national agencies, scientific institutions and private companies undertake air quality monitoring in accordance with an appropriate quality assurance and control programme, as set out in government guidance, which aims:
- To provide data which is representative of ambient concentrations existing in those areas of the town under investigation.
- To ensure, as appropriate, that measurements are sufficiently accurate and precise.
- To ensure data is inter-comparable and reproducible (results should be internally consistent and where possible comparable with nationally accepted standards);
- To ensure measurements are consistent over time, particularly for the purpose of undertaking long-term trend analysis of air quality across an area or region.
Irrespective of the technique, monitoring can provide data, which, given that it is sufficiently reliable, can be used with appropriate analysis and interpretation for the following purposes:
- Establishing a sound scientific basis for policy development
- Determining compliance with air quality standards and objectives
- Research needs
- Assessing air quality trends
- Validating and calibrating air pollution dispersion models
- Assessing the effectiveness of control policies
- Public information
- National and local air quality management.
Therefore, to ensure the above objectives can be achieved a robust quality assurance quality control programme must be followed. QA/QC programmes include an established schedule of regular site calibrations, site service and audits, verification and ratification of all measured data and documentation of all procedures.
After applying the calibration factor measured data are visually screened by air quality experts to see if it contains spurious and unusual measurements, this is how equipment faults or exceptionally high pollution are detected. Any suspicious data is marked for further detailed analysis. This process is known as data verification. The final process is data ratification which is a more thorough check at 3 to 6 monthly interval to ensure data remains reliable and consistent.